
FII and DII Data (Trading Activity)- Importance of FIIs & DIIs
Introduction
People like us, who individually invest in stocks, are called Retail Investors. We are also called Individual Investors. Mutual Funds, Pension Funds, and other Investment Institutions are collectively referred to as Institutional Investors. Together, we form a critical part of our financial system.
I hope you might have heard about these two terms FII and DII somewhere like on television channels, reporters claiming that FII and DII have started buying shares or selling shares,
you might have wondered what are these FII and DII? And how to check FII and DII data (Trading Activity)? , Therefore, in this article, let’s explain the concept in detail.
What is FII and DII in the Stock Market?
Institutional investors in India can include foreign investors as well as domestic investors.
When India opened its market for foreign investment, it became known as Foreign Institutional Investors (FIIs).
To streamline the foreign investment process in India, the government introduced new regulations for foreign portfolio investors (FPIs) in 2014.
These regulations have been enforced by the Securities and Exchange Board of India.
Briefly, FIIs are known as a single foreign investor or a group of foreign investors that make foreign portfolio investments.
Listed below are some of the examples of FIIs in India:
- Blackstone Group
- KKR
- Euro Pacific Growth Fund
- Franklin Templeton Investments Fund
- TPG Group
- Sequoia Capital
DII stands for Domestic Institutional Investors. DIIs are a particular class of investors that undertake to invest in financial assets and securities of the country they are currently residing in.
These DIIs’ investment decisions are influenced by political and economic trends. Like FIIs, DIIs can also have an impact on the economy’s net investment flows.
For example, whenever an Indian institution such as ICICI Bank invests in a company in India, this will be a domestic institutional investor.
Let us now look at how FIIs and DIIs impact the stock market?
Importance of FII & DII Buying and Selling
Institutional investors are commonly known as market drivers as they invest in huge quantities and volume compared to average retail individual investors.
This is reflected in equity prices as they increase and decrease, supported by momentum.
The market reflects when anyone buys or sells stocks in large amounts, though the effect could be in the short term. The presence of these investors is the necessary driver of the marketplace.
FIIs and DIIs also have advanced research and analysis teams to choose the best industry or security for investment. Consequently, if you are able to understand the next target of these giants, you may benefit from investing in these companies.
Also Read Government Bonds India – A Detailed Guide for 2021
FII and DII Activity Data
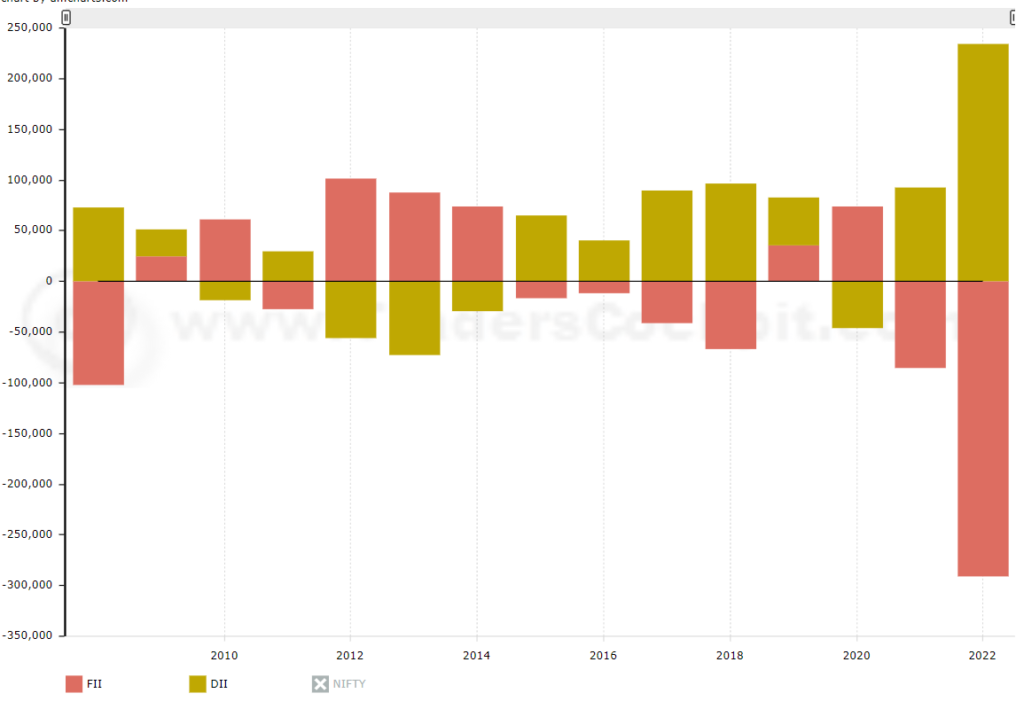
Traditionally, FIIs have played a key role in India’s markets. Their movements have often heavily influenced market orientation. However, the recent exodus of FIIs has partially been offset by the sustained flow from DIIs. Let’s take a look.
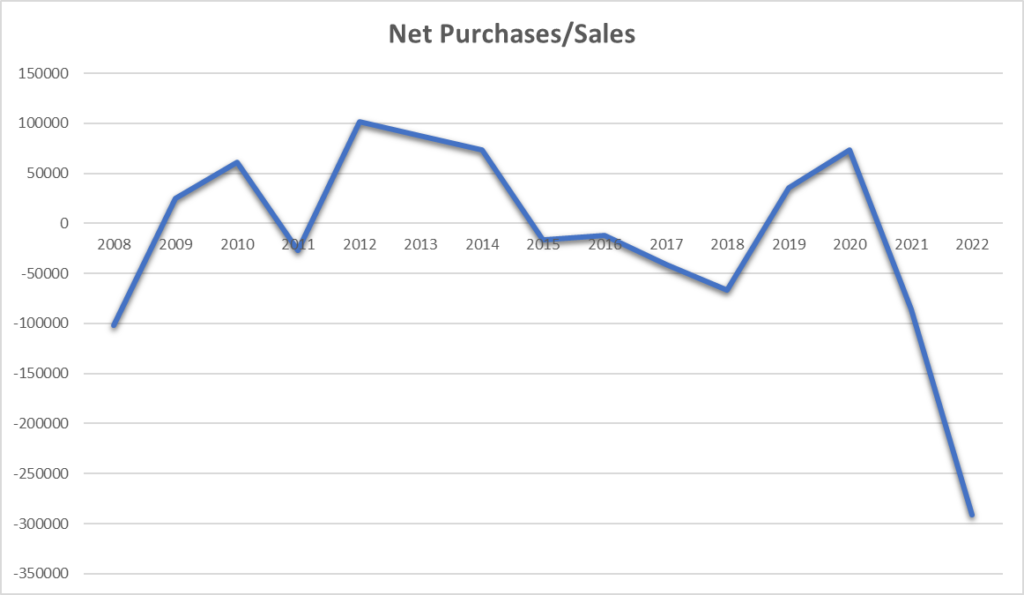
- FIIs Activities in India
| FY | Gross Purchase | Gross Sales | Net Purchases/Sales |
|---|---|---|---|
| 2022 | 971530.8 | 1262331.9 | -290800.97 |
| 2021 | 2113697.5 | 2199367.5 | -85670.15 |
| 2020 | 1744317 | 1670834.9 | 73482.12 |
| 2019 | 1356730.6 | 1320999.2 | 35731.43 |
| 2018 | 1209810 | 1276679.2 | -66869.3 |
| 2017 | 1278001.1 | 1319122.8 | -41121.63 |
| 2016 | 1087344.5 | 1099183.2 | -11838.65 |
| 2015 | 1116463 | 1132898.4 | -16435.56 |
| 2014 | 1001752.4 | 928095.94 | 73656.42 |
| 2013 | 758407.75 | 671048.94 | 87358.79 |
| 2012 | 633960.4 | 532794.25 | 101166.11 |
| 2011 | 593090.06 | 620047.06 | -26957.041 |
| 2010 | 701937.6 | 640712.3 | 61225.25 |
| 2009 | 581159.2 | 556339.06 | 24820.09 |
| 2008 | 687856.2 | 789658.8 | -101802.57 |
- DIIs Activities
| FY | Gross Purchase | Gross Sales | Net Purchases/Sales |
|---|---|---|---|
| 2022 | 923048 | 688479.4 | 234568.66 |
| 2021 | 1456590.5 | 1364184.9 | 92405.59 |
| 2020 | 1070837 | 1116877.8 | -46040.77 |
| 2019 | 916936.8 | 870021.9 | 46914.9 |
| 2018 | 902614.9 | 805969 | 96645.92 |
| 2017 | 826428.1 | 737216.7 | 89211.41 |
| 2016 | 512924.44 | 472843.75 | 40080.69 |
| 2015 | 466455.66 | 401802.56 | 64653.11 |
| 2014 | 364143.25 | 393791.56 | -29648.3 |
| 2013 | 258869.7 | 331240.38 | -72370.68 |
| 2012 | 238655.44 | 294455.53 | -55800.09 |
| 2011 | 284241.44 | 254759.3 | 29482.129 |
| 2010 | 324110.94 | 342743 | -18632.06 |
| 2009 | 307843.4 | 281737.25 | 26106.16 |
| 2008 | 288366.75 | 215399.95 | 72966.78 |
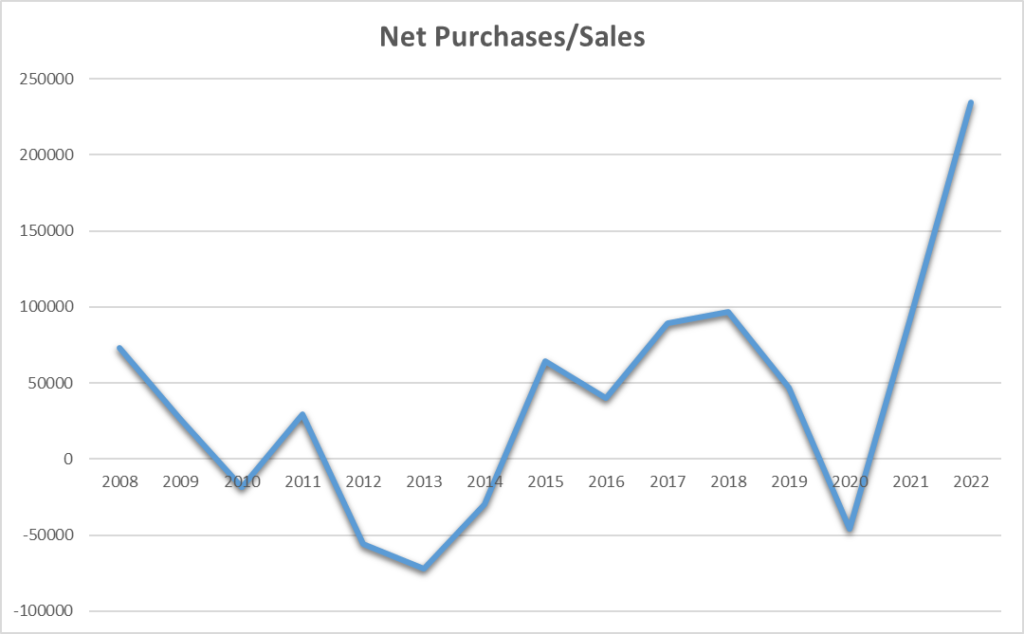
DII ownership of Indian equities is increasing rapidly with continued and increasing SIP investments and a shift to financial savings. Let’s take a look.
How to Check/Read FII and DII Data (Trading Activity)?
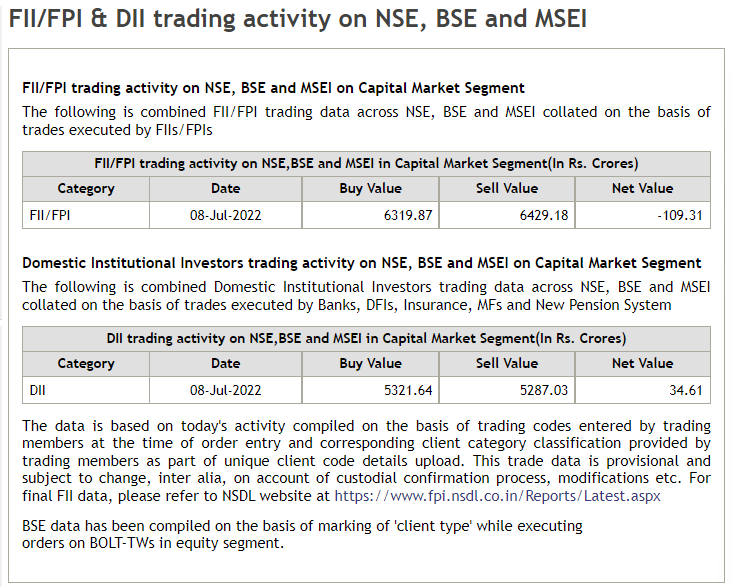
- FII & DII trading activity on NSE, BSE, and MSEI
You can check the FII and DII buy or sell data on the NSE website from the following link.
https://www1.nseindia.com/products/content/equities/equities/fii_dii_market_today.htm
This link will give you the total buy, sell, and net value in rupee terms. If the net worth is positive for a specific segment, they have a net purchase. If the net value is negative, they have made a net sell. However, I would rather use an application called trendlyne. This app gives all the data in a simple form with a history of your analysis.
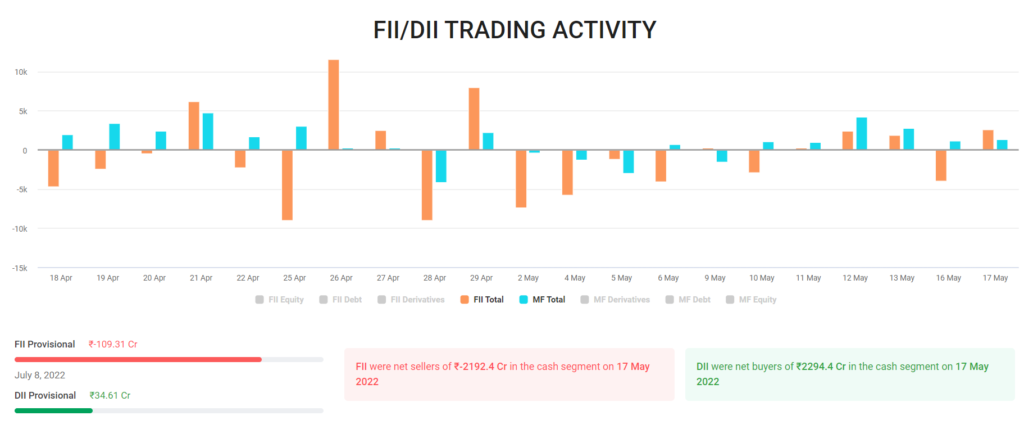
- FII & DII trading activity using the https://trendlyne.com/
Trendlyne’s FII or DII analysis enables you to see how much, and where FII and DII investors buy and sell. It gives you snapshots, daily data, monthly data and insights for equity, borrowing and derivatives inflows and outflows for both FII and MF investors.
You can also access the shareholding of a company through the Trendlyne’s app. To do this, you must visit the Trendlyne Web site and then search your company name on search bar given at top right.
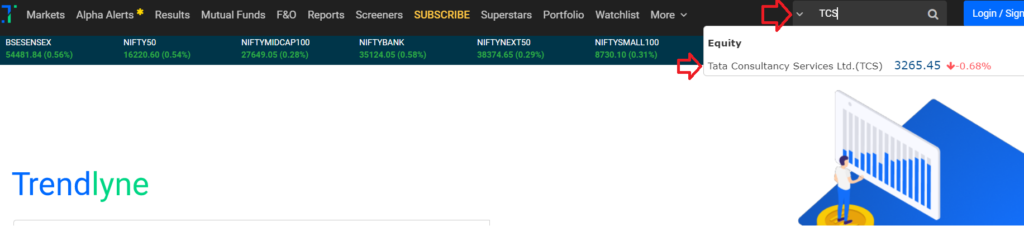
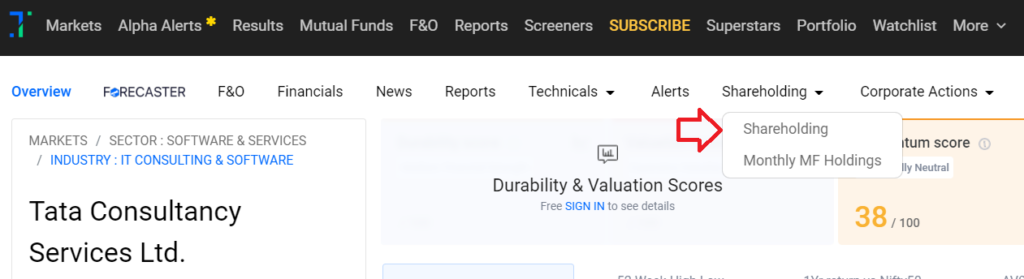
Let’s take an example of TCS’s shareholding pattern. The following graph shows a breakup of shareholding pattern, in percentage terms, as of 10 July 2022.
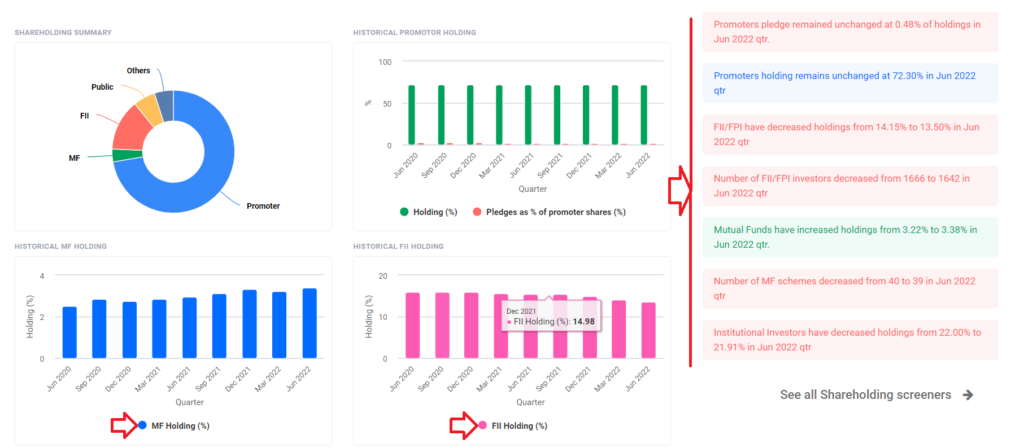
For instance, promoters know their company very well. Therefore, if there is a change in their ownership, this indicates their increasing/decreasing interest in the company.
An increase in promoter ownership sends a positive signal to investors, while a decrease in ownership sends a negative message, raising concerns over the company’s growth and future potential.
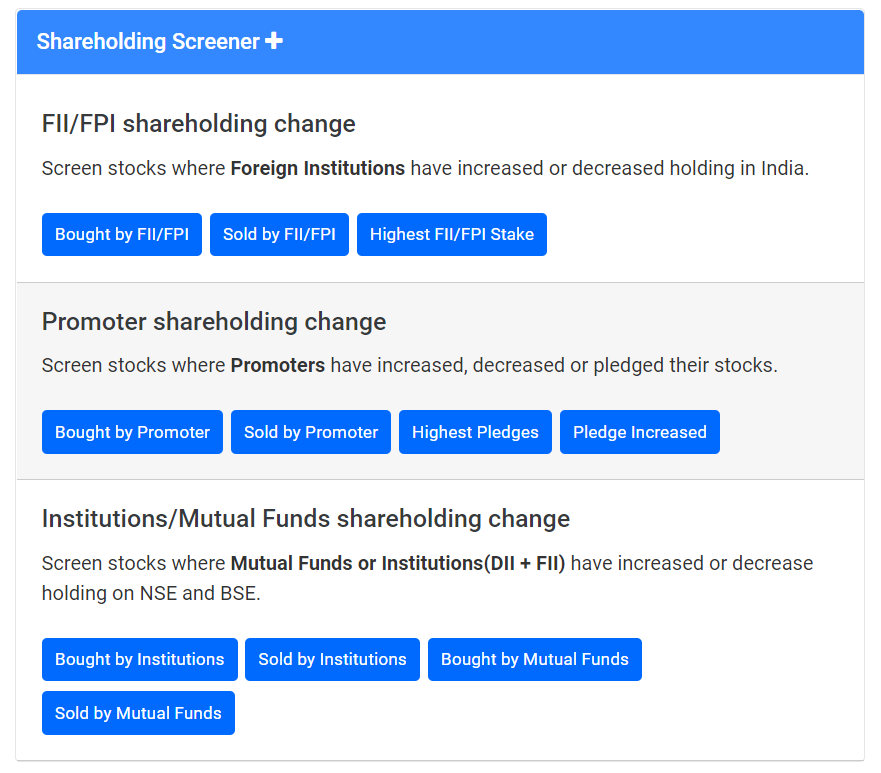
You can also screen stocks where the promoter pledges have changed from the following link.
https://trendlyne.com/stock-screeners/shareholding-change/
The Bottom Line
Whereas FII and DII can be an indicator of market activity, their investment decisions cannot be based on whether FIIs or DIIs buy or not.
It is best to opt for a bottom-up approach. Investors should only bet on companies that have solid fundamentals and are available at reasonable values.
Also Read RBI RDG Account – Buy & Sell G-Secs, Bonds, T-bills, and State Development Loans
Source – https://trendlyne.com/ and https://www.traderscockpit.com/